What Is Standard Deviation? Simple Explanation & Examples
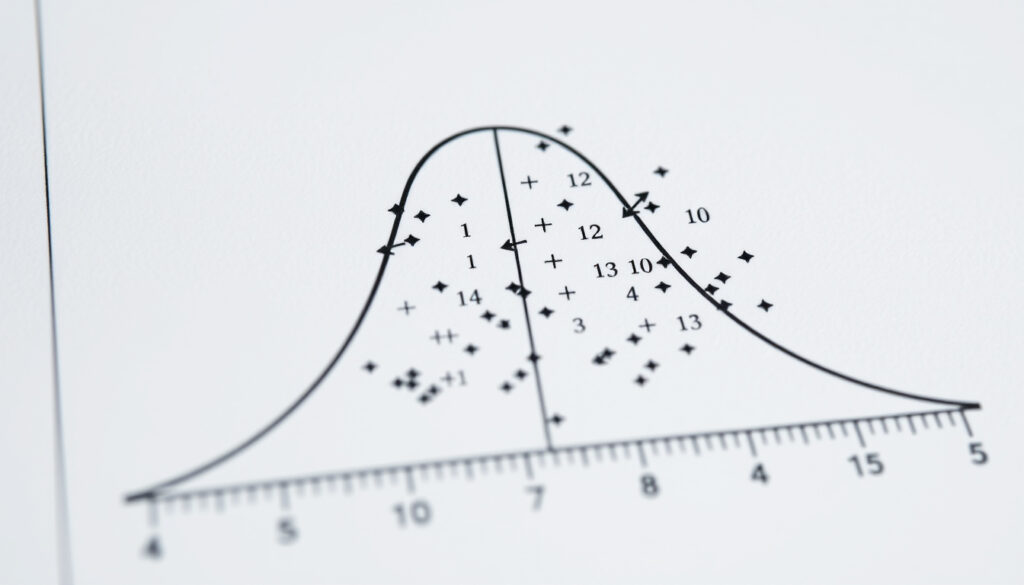
Anyone who has ever looked at a set of numbers and wondered just how varied they are has already met the core idea behind standard deviation. It’s the statistic that tells you whether your data is tightly grouped or all over the place.
Symbol: σ (sigma) ·
Formula: √(Σ(xi – μ)² / N) ·
Range: Non-negative (≥ 0) ·
Unit: Same as the data ·
Low SD: Data clustered around the mean ·
High SD: Data spread widely
Quick snapshot
- Standard deviation is the square root of variance (Britannica, encyclopedia publisher).
- For normally distributed data, 68% lies within 1 SD, 95% within 2 SD (NIH, U.S. health agency).
- Low SD indicates low dispersion; high SD indicates high dispersion (Britannica, encyclopedia publisher).
- Why some textbooks use n-1 for sample standard deviation (Bessel’s correction) – often not explained simply (Sigmapedia, statistics glossary).
- Whether to use population or sample formula in specific real-world contexts (e.g., when you have a full census vs. a subset). (Sigmapedia, statistics glossary)
- Standard deviation is a static measure of spread, not a time-series indicator. It does not track trends over time.
- Learn how to calculate SD by hand and with tools (BBC Bitesize, educational resource).
- Apply the empirical rule to interpret any normally distributed dataset. (BBC Bitesize, educational resource)
Six key facts about standard deviation, one pattern: the formula changes depending on whether you’re measuring a whole population or a sample.
| Label | Value |
|---|---|
| Full name | Standard deviation |
| Symbol | σ (population), s (sample) |
| Formula (population) | √(Σ(xi – μ)² / N) |
| Formula (sample) | √(Σ(xi – x̄)² / (n-1)) |
| Range | 0 to ∞ |
| Related concept | Variance (squared SD) |
The implication: knowing which formula to use is the first practical fork in the road for anyone working with data.
What is standard deviation in simple words?
Standard deviation measures how spread out numbers are from the average. As the Britannica encyclopedia puts it, it is “a measure of the amount of variation of the values of a variable about its (arithmetic) average.” Low standard deviation means values cluster near the mean; high standard deviation means they spread widely. The symbol is sigma (σ). It is the square root of variance, which restores the spread to the original units of the data (NIST, U.S. measurement standards agency).
How to explain standard deviation to a child?
- Use an analogy: how far classmates are from a teacher in the classroom.
- If everyone sits close to the teacher (the mean), the standard deviation is small.
- If some sit far away, the standard deviation is large.
- No math required; focus on the idea of spread.
A child-friendly explanation sidesteps formulas entirely. The goal is to build intuition: standard deviation is simply a measure of how much things vary.
What is a high standard deviation?
- A high standard deviation means data points are widely spread from the mean (NIH, U.S. health agency).
- There is no fixed cutoff — it depends on the context. An SD of 10 for test scores might be high, but for stock returns it might be moderate.
What is standard deviation in finance?
- In finance, standard deviation is used as a measure of volatility and risk (Investopedia, financial education publisher).
- A higher standard deviation indicates higher price variability, which is often associated with higher risk.
What is standard deviation in physics?
- In physics, standard deviation quantifies measurement uncertainty and experimental error.
- It tells scientists how much repeated measurements typically vary from the average.
What is standard deviation in trading?
- Traders use standard deviation to assess market volatility and set price targets.
- Bollinger Bands, a popular technical indicator, are built around standard deviation.
How do I calculate a standard deviation?
The calculation procedure is straightforward: subtract the mean from each observation, square the deviations, sum them, divide by the appropriate denominator, and take the square root (BBC Bitesize, educational resource).
How do you calculate SD by hand?
- Find the mean of the dataset.
- Subtract the mean from each value to get deviations.
- Square each deviation.
- Sum the squared deviations.
- Divide by N (for population) or n-1 (for sample) to get variance.
- Take the square root of the variance.
What is the fastest way to calculate standard deviation?
- Use a calculator with built-in SD functions, or a spreadsheet like Excel (STDEV.P or STDEV.S).
- Online calculators are also available – just enter your data.
What is the standard deviation of 5 5 9 9 10 5 10 10?
- Dataset: 5,5,9,9,10,5,10,10. Mean ≈ 7.875.
- Variance ≈ 3.86, SD ≈ 1.96 (using the formula described by BBC Bitesize).
- Note: this example uses the population formula; for a sample the divisor would be n-1.
How to calculate standard deviation from mean?
- You need the full dataset, not just the mean. The mean is the starting point.
- From each data point, subtract the mean, square, sum, divide, and root.
The catch: the formula changes depending on whether you’re working with a population or a sample. Using the wrong denominator can skew your results.
What does a 1.5 standard deviation mean?
A data point that is 1.5 standard deviations above the mean is relatively high. In a normal distribution, it corresponds to approximately the 93rd percentile. This means the value is higher than about 93% of all data points.
What does +- 2 standard deviations mean?
- In a normal distribution, about 95% of data falls within 2 standard deviations above and below the mean (NIH, U.S. health agency).
- Values beyond 2 SD are considered unusual or outliers.
- This principle is used in hypothesis testing and quality control (e.g., Six Sigma).
How to interpret standard deviation results?
- Always compare SD in the context of the mean. A common reporting format is “mean ± SD” (e.g., “20 minutes, SD 5” from Statistics by Jim, statistics educator).
- Use the empirical rule: 68% within 1 SD, 95% within 2 SD, 99.7% within 3 SD.
What is the empirical rule?
- The empirical rule (68-95-99.7) applies to normal distributions.
- It states that 68% of data falls within 1 standard deviation of the mean, 95% within 2 SD, and 99.7% within 3 SD.
The empirical rule turns standard deviation into a powerful shortcut: you can instantly estimate the likelihood of any value in a normal distribution without complex calculations.
The trade-off: the empirical rule only works for data that is approximately normally distributed. For skewed data, percentiles are more reliable.
How to explain standard deviation to a child?
Imagine a teacher standing in the middle of the classroom. Some students sit very close to the teacher — that’s a small standard deviation. Others sit far away, near the walls — that’s a large standard deviation. The teacher’s position is the average, and the distance each student sits is how much they deviate. No formulas needed. The key is that standard deviation measures “how spread out” the students are.
The simplest explanation for a child is also the most robust: standard deviation is a measure of spread. Adults often overcomplicate it with formulas, but the intuition is universal.
What this means: a child-friendly explanation isn’t just for kids — it’s a reminder that the core concept is simple. The math comes later.
What does +- 2 standard deviations mean?
In a normal distribution, about 95% of data falls within 2 standard deviations above and below the mean (NIH, U.S. health agency). This is a cornerstone of the empirical rule. Values beyond 2 SD are considered unusual and are often flagged as outliers. In quality control, processes are designed to keep output within 2 or 3 SD units (Six Sigma aims for 6 SD).
What does a 1.5 standard deviation mean?
- As noted, 1.5 SD above the mean is about the 93rd percentile.
- It’s a benchmark: a value at 1.5 SD is noticeably high but not extreme.
How to interpret standard deviation results?
- Standard deviation is most meaningful when compared to the mean and the shape of the distribution.
- Report it as “mean ± SD” to give readers a quick sense of variability.
The pattern: the 2 SD threshold is a practical rule of thumb for identifying unusual values, but it assumes a normal distribution. For real-world data, always check the distribution first.
Clarity: what we know and what we don’t
Confirmed facts
- Standard deviation is the square root of variance (Britannica).
- For normally distributed data, 68% lies within 1 SD, 95% within 2 SD (Wikipedia).
- Low SD indicates low dispersion; high SD indicates high dispersion (Investopedia, financial education publisher).
What’s unclear
- Why some textbooks use n-1 for sample standard deviation (Bessel’s correction) – often not explained simply (Sigmapedia, statistics glossary).
- Whether to use population or sample formula in specific real-world contexts.
- The exact threshold for what constitutes a high standard deviation varies by context and is not universally defined.
The pattern: the confirmed facts are well-established, while the unclear aspects often trip up beginners. Understanding the distinction between population and sample formulas is crucial.
Expert perspectives on standard deviation
Standard deviation is a measure of the amount of variation of the values of a variable about its (arithmetic) average.
A standard deviation (or σ) is a measure of how dispersed the data is in relation to the mean.
— NIH, U.S. health agency
Standard deviation measures how far values in a dataset typically deviate from the mean.
These three sources — an encyclopedia, a government health agency, and a financial education site — all agree on the core definition. The consistency across domains reinforces the universal nature of standard deviation.
Summary: why standard deviation matters
Standard deviation is more than a formula — it’s a lens for seeing variability. Whether you’re a student, an investor, or a scientist, understanding SD helps you answer the question: “How unusual is this?” For a trader evaluating volatility, the choice is clear: use standard deviation to set risk limits, or risk being blindsided by market swings. For a medical researcher, reporting SD alongside the mean is the standard way to communicate uncertainty. Master the concept, and you unlock a tool that works across every data-driven field.
Related reading: **Big Five Personality Test Guide** · **What Is Bipolar Disorder?**
stats.libretexts.org, itl.nist.gov, itl.nist.gov, csrc.nist.gov, stats.libretexts.org, nist.gov
Frequently asked questions
What is the difference between standard deviation and variance?
Variance is the average of squared deviations from the mean. Standard deviation is the square root of variance, bringing the measure back to the original units of the data. Variance is in squared units (e.g., square dollars), while SD is in the same units as the data (e.g., dollars).
Can standard deviation be negative?
No. Standard deviation is always non-negative because it is the square root of a non-negative number (variance). The smallest possible value is 0, which occurs when all data points are identical.
What is the standard deviation of a constant dataset?
If all values are the same, standard deviation is 0. There is no variation.
How does sample size affect standard deviation?
Standard deviation is a measure of spread in the data, not the sample size. However, as sample size increases, the estimate of the population standard deviation generally becomes more precise. The standard error (SD divided by √n) decreases with larger n.
What is the relationship between standard deviation and standard error?
Standard error (SE) is the standard deviation of the sampling distribution of the mean. SE = SD / √n. It measures how much the sample mean is expected to vary from the population mean.
How is standard deviation used in Six Sigma?
Six Sigma aims for processes that produce defects fewer than 3.4 per million opportunities, which corresponds to a process mean that is 6 standard deviations from the nearest specification limit. It uses standard deviation to measure process variation.
What is the standard deviation of a binary variable?
For a binary variable (0 or 1), the standard deviation is √(p(1-p)), where p is the proportion of 1s. The maximum SD occurs when p=0.5, giving SD = 0.5.
More related posts
 SGD to RM Exchange Rate: Live Rates, History & Forecast
 Sea Aquarium Opening Hours – Sentosa Daily Schedule 2025
 Best English Tuition Singapore: Compare Top Centres & Costs
 2025 Singapore General Election Rallies: Final Day Sites
 Ho Chi Minh to Hanoi – Flights, Trains, Buses and Driving
 Universal Studios Singapore Annual Pass: Price, Worth It? 2025 Guide
 What Is a USB-C? Differences from USB-A, USB-B Explained
 Morning Greetings and Blessings: Best Wishes, Quotes & Messages